Texas lost jobs in October and faces major headwinds with a weak U.S. economy and a poor performance by this year’s 88th Legislature. There is a better way.
- This included the largest spending increase, largest corporate welfare increase, largest amount passed in constitutional amendments, and subsequent second-largest property tax cut in the state’s history.
- Texas has yet to pass universal education savings accounts during the ongoing fourth special session called by Gov. Greg Abbott (R), and likely will not pass them until at least 2025.
- Texans expect more from the largest red state in the country.
Free-market capitalism is the best path to let people prosper, as it is the best economic institution that supports jobs and entrepreneurship for more people to earn a living, gain skills, and build social capital.
Table 1 shows Texas’ labor market for October 2023 from the U.S. Bureau of Labor Statistics. These data compare the following important dates: 1) June 2009—Dated trough of that U.S. recession, 2) February 2020—Dated peak of the last U.S. expansion before the COVID-19 shutdowns, 3) April 2020—Dated trough of the last U.S. recession, and 4) October 2023—Latest data available.
| December 2007 | February 2020 | April 2020 | October 2023 | |
|---|---|---|---|---|
| Labor force participation rate | 65.7% | 63.8% | 60.3% | 64.2% |
| Employment-population ratio | 62.8% | 61.6% | 52.6% | 61.6% |
| Unemployment rate (U3) | 4.4% | 3.6% | 12.8% | 4.1% |
| Total nonfarm employment | 10.57M | 12.97M | 11.51M | 14.05M |
| Private sector employment | 8.78M | 10.96M | 9.56M | 11.98M |
The labor market declined last month continuing a weakening trend in Texas.
- The payroll survey shows net nonfarm jobs in Texas declined by 1,300 last month, resulting in the first decline after employment increases in 40 of the prior 41 months. This brings employment down to 14.04 million, breaking the streak of record highs for 24 straight months.
- Compared with a year ago, total employment was up by 391,500 (+2.9%)—the third fastest growth rate in the country—with the private sector adding 339,400 jobs (+2.9%) to 11.98 million and the government adding 52,100 jobs (+2.6%) to 2.07 million.
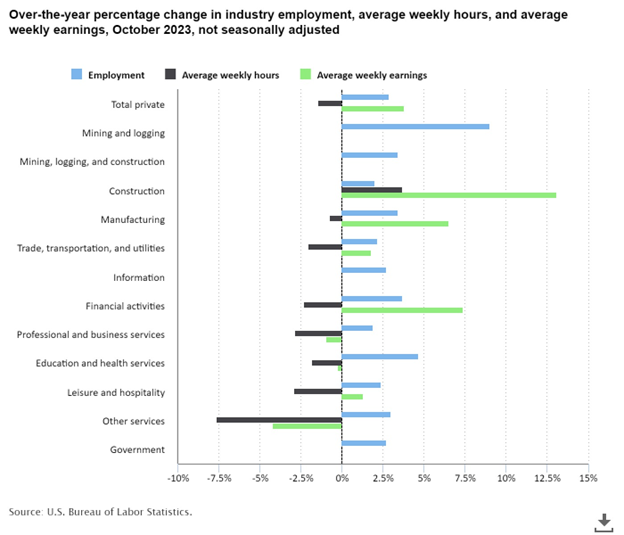
- Figure 1 shows that inflation-adjusted average weekly earnings are increasing in some industries in Texas, with inflation still running hot at least at 3.2%. Many Texans are struggling to keep up with less purchasing power from excessive spending by Congress, excessive regulations by President Biden, and excessive money printing by the Federal Reserve. But these are exacerbated by excessive state and local spending, high local property taxes, restrictive local zoning, and other factors in Texas.
Figure 1. Texas’ Labor Market by Industry
- The household survey shows that the labor force participation rate is higher and the employment-population rate matches those in February 2020, but the former is well below December 2007 at the start of the Great Recession.
- The state’s unemployment rate of 4.1% is higher than the U.S. rate of 3.9% but this is a weak indicator as it’s highly volatile based on changes in the labor force, and the labor force continues to increase in Texas unlike in many states.
- Shortages in the labor market are across the economy as many still sit on the sidelines from profligate safety nets primarily from the federal government over the last three years
The economy continues to expand in Texas though there are headwinds.
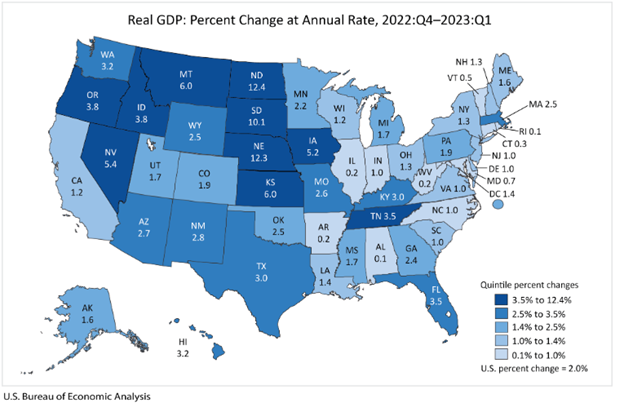
- The U.S. Bureau of Economic Analysis (BEA) reported the real gross domestic product (GDP) by state for 2022.
- Figure 2 shows Texas had the fifteenth fastest real GDP growth of +3.0% to $1.94 trillion in 2023:Q1 (above the U.S. average of +2.0% to $20.28 trillion).
Figure 2. Texas had the 15th Highest Real GDP Growth in 2023:Q1
- The BEA also reported that personal income in Texas grew by 6.7% to $1.94 trillion in 2023:Q1 which was the 22nd highest in the country. This is above the U.S. growth rate of 5.1% (to $22.51 trillion).
As Texans face an affordability crisis from high inflation and high property taxes and an uncertain future with the U.S. economy likely in a deepening recession, the Legislature provided some tax relief but not nearly enough because of excessive spending.
- Other states are cutting, flattening, and phasing out taxes, passing responsible budgets, and passing school choice, so Texas should have made bold reforms to support more opportunities to let people prosper, mitigate the affordability crisis, and withstand destructive policies out of D.C.
Figure 3 provides a comparison of the size of government, economic freedom, and economic outcomes among the four largest states and nearby Louisiana.
Figure 3. Comparison of Key States
| Measure | U.S. | Florida | Tennessee | Texas | Georgia | Louisiana | California | New York |
|---|---|---|---|---|---|---|---|---|
| Economic Freedom of North America (2021) | 5th (World) | 2nd | 3rd | 4th | 8th | 20th | 49th | 50th |
| State Migration Trends, Most Inbound (2022) | — | 1st | 11th | 4th | 12th | 48th | 41st | 50th |
| State Business Tax Climate (2024) | — | 4th | 15th | 13th | 32nd | 40th | 48th | 49th |
| State Economic Outlook (2023) | — | 9th | 11th | 13th | 12th | 26th | 45th | 50th |
| State & Local Spending Per Capita (2022) | — | 46th | 37th | 37th | 48th | 26th | 4th | 2nd |
| S&L Spending on Public Welfare Per Capita (2020) | — | 47th | 44th | 44th | 49th | 12th | 5th | 1st |
| S&L Tax Burden Per Capita (2022) | — | 11th | 3rd | 6th | 8th | 12th | 46th | 50th |
| S&L Property Tax Collections Per Capita (2020) | — | 22nd | 4th | 39th | 19th | 7th | 36th | 46th |
| Composite Cost of Living Index (Q3:2023) | — | 31st | 9th | 18th | 11th | 10th | 48th | 47th |
| Avg. U-3 Unemployment Rate (2003-22) | 6.0% | 5.6% | 6.0% | 5.6% | 6.3% | 5.9% | 7.3% | 6.2% |
| Avg. Labor Force Participation Rate (2003-22) | 64.0% | 60.6% | 61.8% | 65.2% | 64.4% | 60.1% | 63.5% | 61.5% |
| Avg. Annual Nonfarm Payroll Growth (2003-22) | 0.8% | 1.4% | 1.0% | 1.8% | 1.1% | 0.1% | 1.0% | 0.6% |
| Avg. Top 5% Income Shares (2003-18) | 36.9% | 44.6% | 33.6% | 36.8% | 34.2% | 32.2% | 39.4% | 47.1% |
| Official Poverty Measure (2019-21) | 11.2% | 12.5% | 12.2% | 12.9% | 13.1% | 17.2% | 11.0% | 12.3% |
| Supplemental Poverty Measure (2019-21) | 9.6% | 11.9% | 9.1% | 10.4% | 10.2% | 11.7% | 13.2% | 12.1% |
- While Texas does relatively well, there is much more to do for more liberty and prosperity.
The Texas Legislature should improve the Texas Model by:
- Passing pro-growth policies that:
- Spend Less: Lower state government spending and pass responsible local spending limits.
- Tax Less: Start eliminating local property taxes with historic surpluses at the state level to buy down school district M&O property taxes and at the local level by using their own surpluses to buy down their own property tax rates.
- Regulate Less: Improve workforce development, remove barriers to work, reduce occupational licensing, reform safety nets, and enact universal school choice.
Strengthening the Texas Model will help Texans better resist D.C.’s overreach, be more competitive with other states, and, more importantly, flourish more for generations to come.
Texans for Fiscal Responsibility relies on the support of private donors across the Lone Star State in order to promote fiscal responsibility and pro-taxpayer government in Texas. Please consider supporting our efforts! Thank you!
Get The Fiscal Note, our free weekly roll-up on all the current events that could impact your wallet. Subscribe today!