

Highlights
- People prosper most from free-market capitalism; we need more of it in America.
- Americans are suffering from big-government policies out of D.C.
- This brief highlights more than just the headlines you usually get.
Figure 1: Real Average Weekly Earnings Remain Down 4.2% Since January 2021
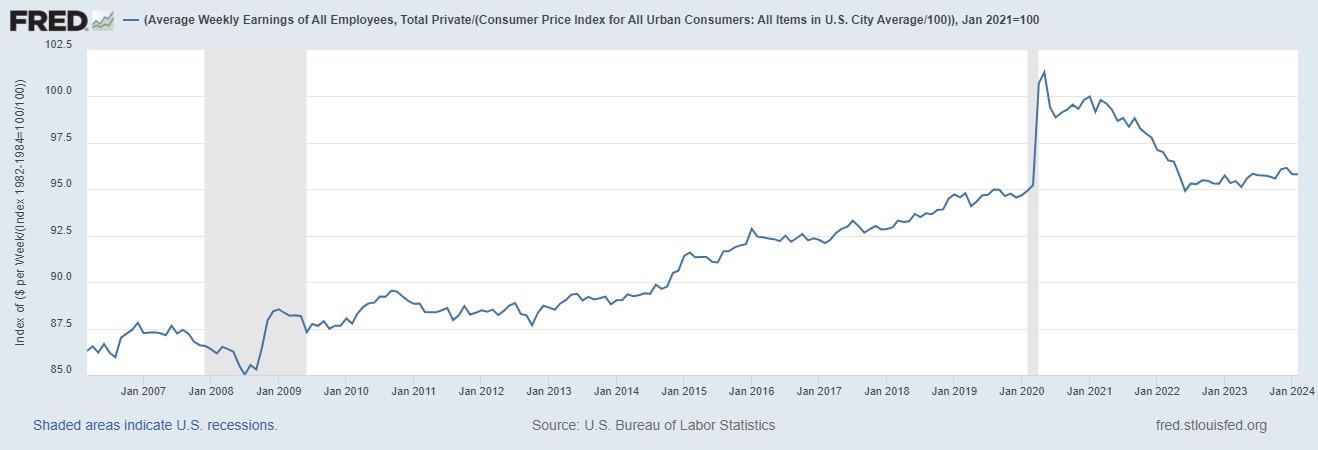
Source: Fed FRED
Labor Market
The Bureau of Labor Statistics recently released its U.S. jobs report for February 2024, which was another mixed report with some strengths but many weaknesses.
- The establishment survey is the most reported.
- Employment increased by 275,000 net nonfarm jobs in February to 157.8 million. Nonfarm employment increased by 2.7 million over the last year and up by 5.5 million since February 2020 before the COVID-related lockdowns. This is much lower than the 15 million jobs President Biden claims were added during his tenure, as about 10 million jobs were recovered after the lockdowns.
- There have been large jobs added revisions in previous months as the data used for seasonal adjustments are from the last few years when there was substantial volatility in the labor market and other reasons. These include downward revisions for job creation of 43,000 to 290,000 in December 2023 and 124,000 to 229,000 in January 2024, for a total downward revision of 167,000 jobs. This means the net increase in February was only 108,000 jobs added, indicating a weaker-than-reported labor market.
- Last month, 223,000 jobs were added in the private sector to 134.6 million (85% of total jobs), and +36,000 jobs added in the government sector to 23.2 million (15%). Over the last 12 months, the 2.7 million jobs added across the country (+1.8%) comprised 2.1 million jobs in the private sector (+1.6%) and 629,000 in the government sector (+2.8%).
- Figure 2 shows the industries where jobs were added over the last year, with declines in the industries of transportation and warehousing and information.
Figure 2. Changes in Employment by Industry Over the Last Year
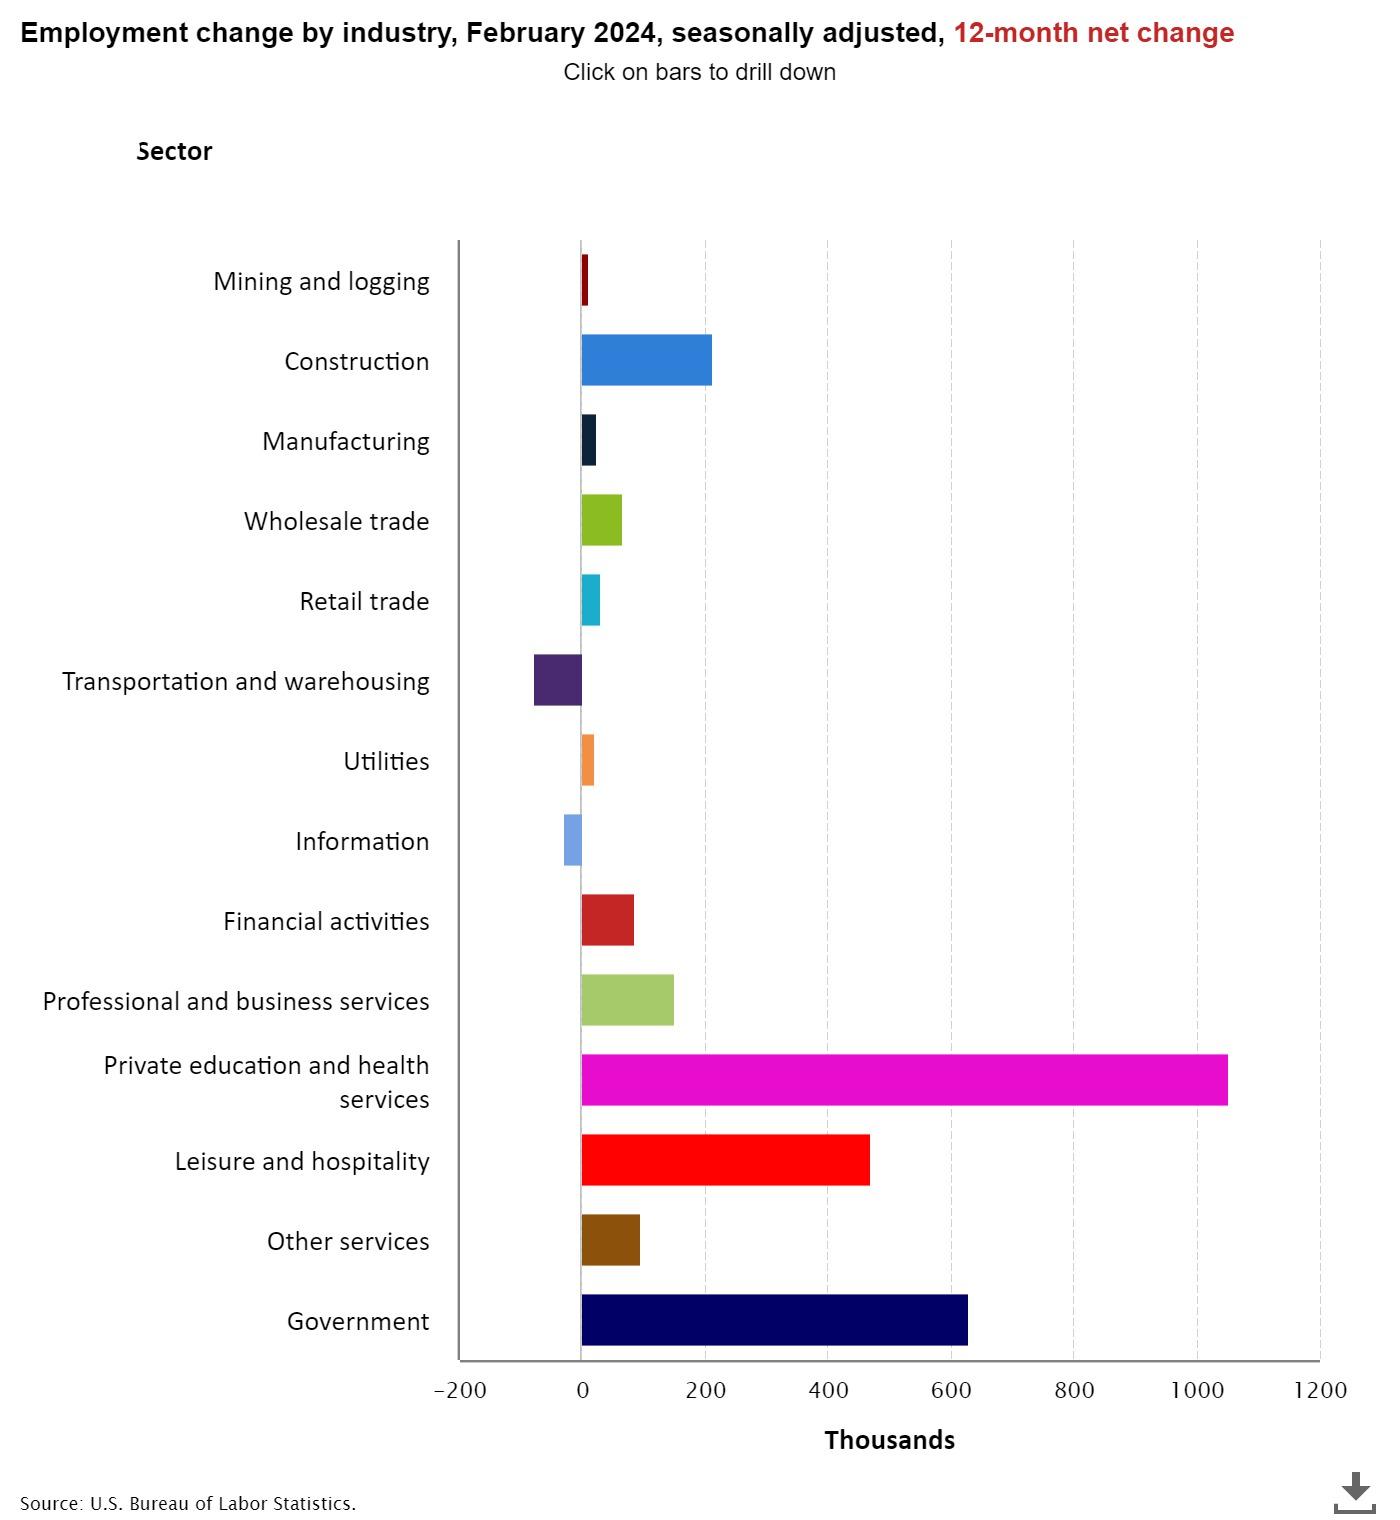
Source: Fed FRED
- The household survey is important but often not reported.
- Employment fell by 184,000 jobs in February to 160.9 million employed. Net employment has declined in four of the last five months and five of the last ten months for a total decline of 582,000 jobs since September 2023 and just 60,000 jobs added since March 2023.
- Figure 3 shows how these two surveys have diverged since March 2022, when there were two consecutive quarters of declining real GDP (i.e., recession), after indexing both employment measures to 100 in January 2021. While these two surveys typically track each other closely, this has not been the case since then, and the establishment of nonfarm employment now exceeds household employment level by 2.8%, which could mean that nonfarm employment is over-reported by at least 4.4 million jobs.
Figure 3. Establishment Nonfarm Jobs Far Outpace Household Employment Level Since March 2022
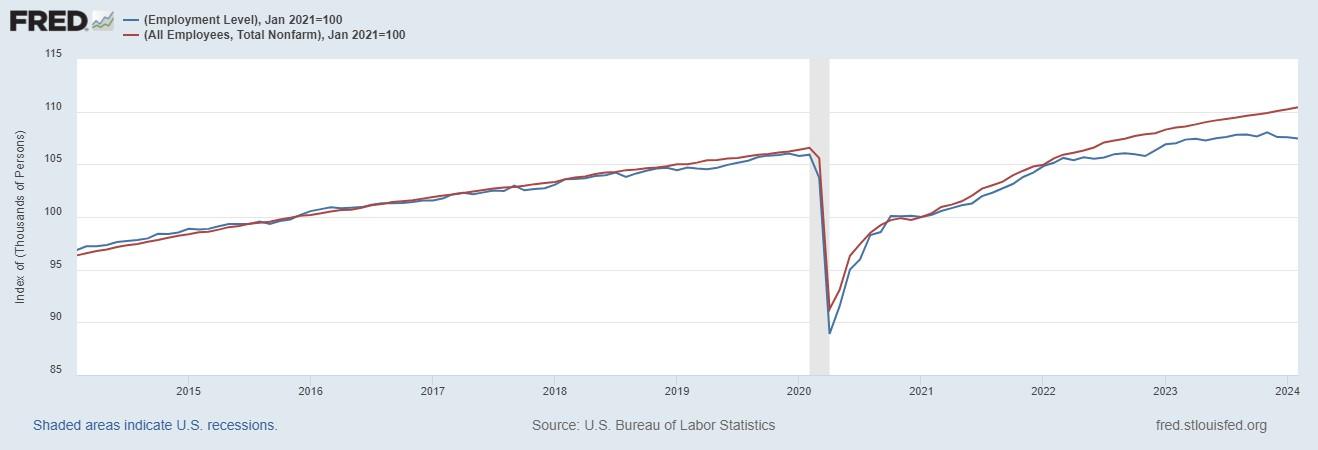
Source: Fed FRED
- The labor force increased by 150,000 in February 2024 to 167.4 million. The labor force has declined in four of the last ten months and is up 1.2 million since February 2023.
- The unemployed increased by 334,000 last month to 6.5 million, bringing the official U3 unemployment rate up to 3.9%, and the broader U6 underutilization rate is up to 7.3%.
- Since February 2020, the prime-age (25-54 years old) employment-population ratio has been essentially flat at 80.7% since March 2023 but down from the recent high of 80.9% in July 2023. The prime-age labor force participation rate was 0.5 percentage points higher at 83.5% than in February 2020, and the total labor-force participation rate was 0.8 percentage points at 62.5%, where it has been since February 2023, with millions of people out of the labor force holding the U3 rate artificially low.
Economic Growth
The U.S. Bureau of Economic Analysis recently released the third estimate for economic output in the fourth quarter of 2023.
- Table 1 provides data over time for real total gross domestic product (GDP), measured in chained 2012 dollars, and real private GDP, which excludes government consumption expenditures and gross investment.
Table 1: Economic Output, Growth, and Inflation
| Q4/Q4 2021 | Q4/Q4 2022 | Q4/Q4 2023 | Q1:2023 | Q2:2023 | Q3:2023 | Q4:2023 | |
| Real total GDP (end of period) | $21.8T | $22.0T | $22.7T | $22.1T | $22.2T | $22.5T | $22.7T |
| Annualized growth (avg for period) | +5.4% | +0.7% | +3.1% | +2.2% | +2.1% | +4.9% | +3.4% |
| Real private GDP (end of period) | $18.2T | $18.3T | $18.8T | $18.4T | $18.4T | $18.6 | $18.8 |
| Annualized growth (avg for period) | +6.6% | +0.6% | +2.9% | +1.7% | +1.8% | +4.7% | +3.1% |
| GDP implicit inflation (avg for period) | +6.2% | +6.4% | +2.6% | +3.9% | +1.7% | +3.3% | +1.7% |
Another key measure of economic activity is the real average of GDP and GDI, which accounts for domestic production and income and is known as real gross domestic output. Real GDO in the third quarter increased by 3.4%, and in the fourth quarter increased by 4.1% to $22.5 trillion. Figure 4 shows how this measure has declined on an annualized basis in three of the last eight quarters, increasing this value by only 2.9% since the fourth quarter of 2021 before the two consecutive quarters of declines in the first and second quarters of 2022.
Figure 4. Annualized Real Gross Domestic Output Growth
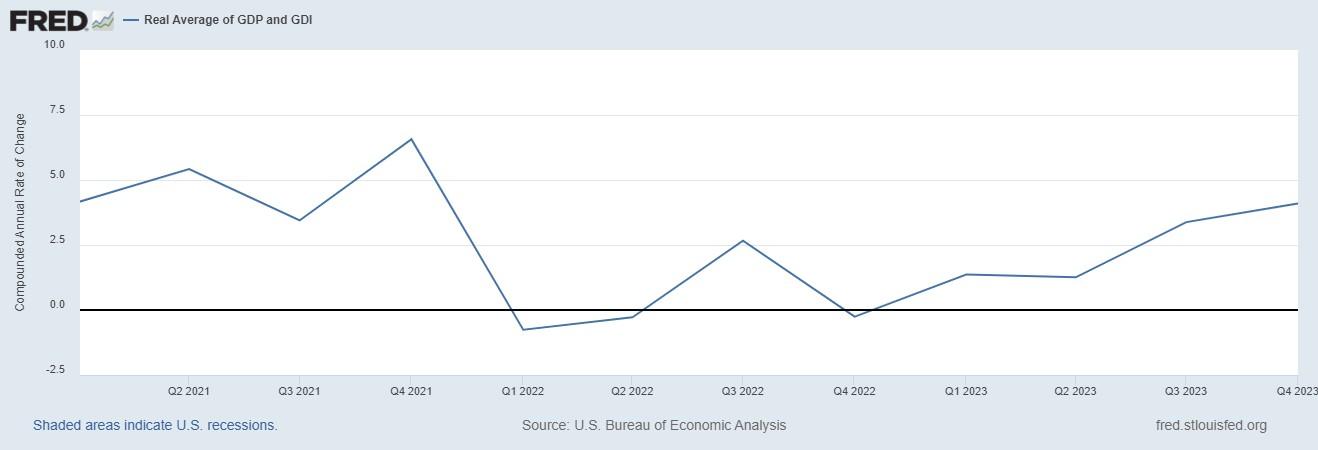
Source: Fed FRED
Meanwhile, the federal budget deficit continues unabated because of overspending and declining tax collections from a weaker economy. The national debt has ballooned to $34.6 trillion, and net interest payments on the debt will soon be a top federal expenditure, rising to above $1 trillion. The Federal Reserve has monetized, or printed, much of the new Treasury debt to keep interest rates artificially lower than where the market would suggest. The Fed will need to cut its balance sheet (total assets over time) more aggressively if it is to stop manipulating markets (see this for types of assets on its balance sheet) and persistently tame inflation.
The current annual inflation rate of the consumer price index (CPI) has been moderating since a peak of 9.1% in June 2022 but remains elevated at 3.2% in February 2024. Compared with the Fed’s average inflation rate target of 2%, which really should be 0%, the current CPI inflation rate is too high, as are other key measures of inflation. A recent paper by Larry Summers, who was the 71st Secretary of the Treasury for President Clinton and Director of the National Economic Council for President Obama, and co-authors notes that if the calculation of CPI kept housing calculation methods and personal interest payments in, then the latest peak in inflation would have been 18% instead of 8.1%. Figure 5 shows their chart with these data that also highlights how the method-adjusted inflation would be closer to 10% instead of the reported 3.1%
Figure 5. CPI Inflation Differences When Methods Are Similar Over Time
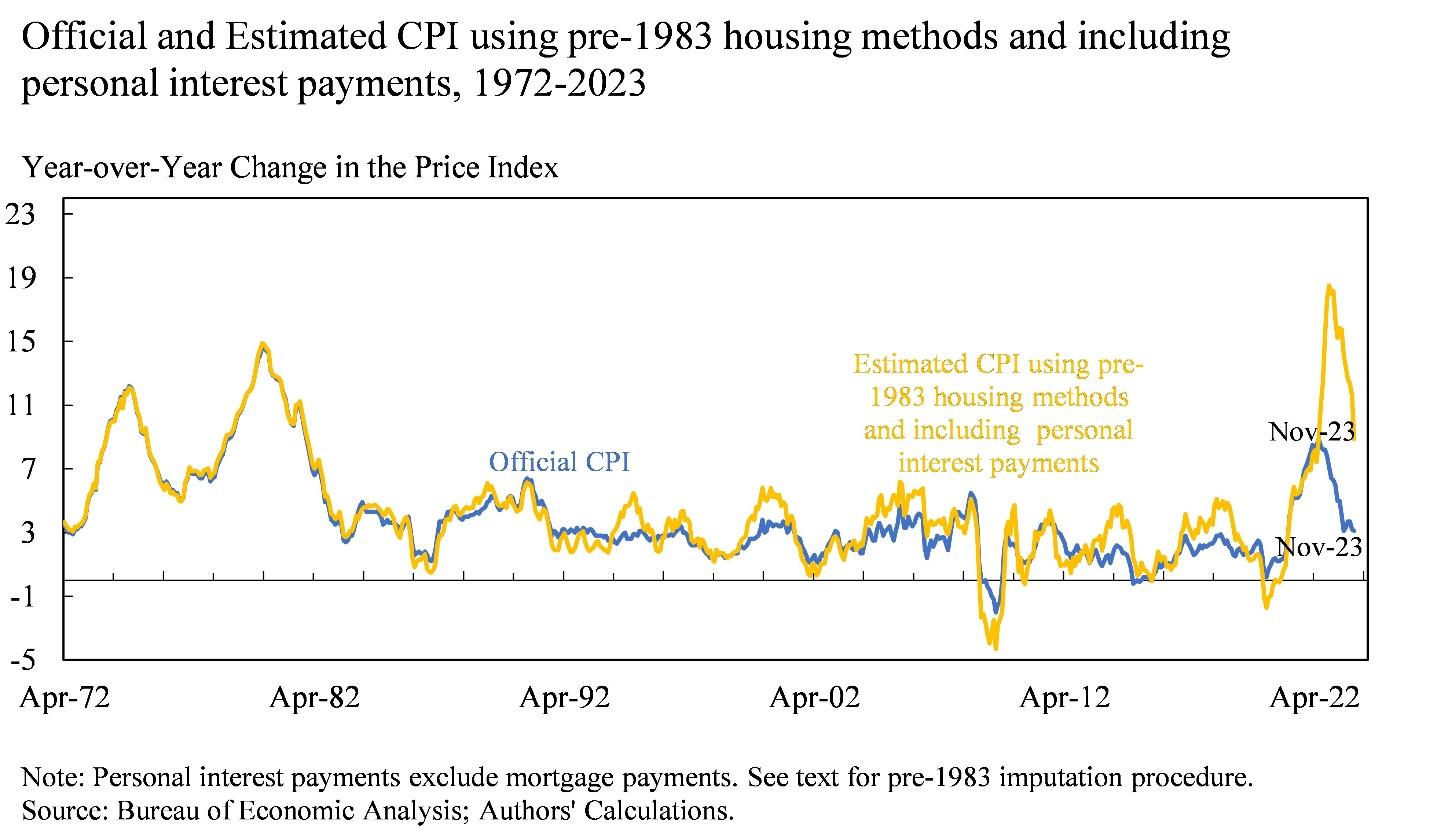
Source: X
Just as inflation is always and everywhere a monetary phenomenon, deficits and high taxes are always and everywhere a spending problem. David Boaz at Cato Institute has noted how this problem is caused by both Republicans and Democrats. To control this fiscal and monetary crisis, the U.S. needs a fiscal rule like the Responsible American Budget (RAB) with a maximum spending limit based on the rate of population growth plus inflation. This was recently released as part of Americans for Tax Reform’s Sustainable Budget Project, highlighting this approach’s benefits at the federal, state, and local levels.
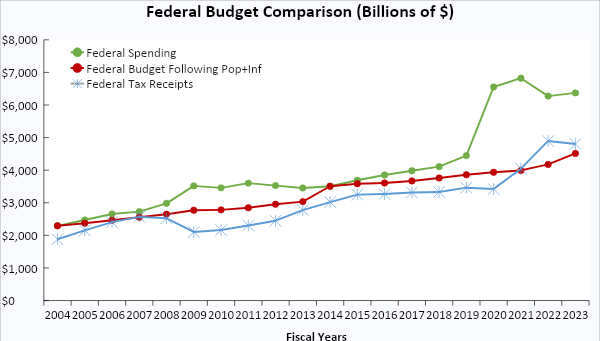
If Congress had followed this approach from 2004 to 2023, Figure 4 shows tax receipts, spending, and spending adjusted for only population growth plus chained-CPI inflation. Instead of an (updated) $20.2 trillion national debt increase, there could have been only a $700 billion debt increase for a $19.5 trillion swing in a positive direction that would have substantially reduced the cost of this debt to Americans. The Republican Study Committee recently noted the strength of this type of fiscal rule in its FY 2025 “Fiscal Sanity to Save America.” To top this off, the Federal Reserve should follow a monetary rule so that the costly discretion stops creating booms and busts.
Figure 6: Federal Budget Gap Shrinks If Spending Limited to Population Growth Plus Inflation
Bottom Line
Bidenomics has been a failure and the policy approach must be redirected to pro-growth policies that shrink government rather than big-government, progressive policies. It’s time for a limited government with sound fiscal and monetary policy that provides more opportunities for people to work and have more paths out of poverty.
Recommendations:
- Set a pro-growth policy path with less spending, regulating, and taxing at all levels of government, which includes return-to-work policies.
- Reject new spending packages that America cannot afford nor needs; pass the RAB instead.
- Impose a strict monetary rule with the Fed having a much smaller balance sheet and a much higher federal funds rate target until we End the Fed.
Texans for Fiscal Responsibility relies on the support of private donors across the Lone Star State in order to promote fiscal responsibility and pro-taxpayer government in Texas. Please consider supporting our efforts! Thank you!
Get The Fiscal Note, our free weekly roll-up on all the current events that could impact your wallet. Subscribe today!