Highlights
- Free-market capitalism is the best way to let people prosper. We need more of it in America.
- Instead, big government actions in D.C. have resulted in a dire economic situation.
- Find out how and what to do about it in this economic brief.
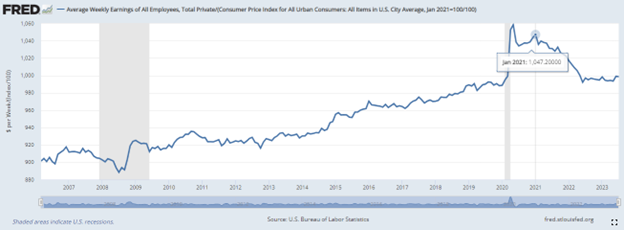
Figure 1: Year-Over-Year Real Average Weekly Earnings Declined for 26 Months Before Increasing in the Last Three but Remains Down Nearly 5% Since January 2021
Overview
- Government failures drove the “shutdown recession” and the stagflationary period over the last three years that has plagued Americans, with more banking and housing market problems to come.
- Solutions to these government failures are pro-growth policies of less spending by Congress, less regulation by the Biden administration, and less money printing by the Fed.
Labor Market
The Bureau of Labor Statistics recently released its U.S. jobs report for April 2023, which was another mixed report with some strengths but many weaknesses.
- The establishment survey is the most reported and shows there were +187,000 net nonfarm jobs added in August to 156.4 million employees, which has increased by +3.1 million over the last year but just +4 million since February 2020. However, there were cumulative revisions in the prior two months of -110,000, so on net, there were just +77,000 jobs indicating a cooling labor market. Over the last month, there were +179,000 jobs added in the private sector and +8,000 jobs added in the government sector before revisions. Most of the private sector jobs were added in the sectors of private education and health services (+102,000), leisure and hospitality (+40,000), and construction (+22,000). But transportation and warehousing lost -34,200 jobs and wholesale trade lost -15,000 jobs last month while information and transportation and warehousing have lost jobs over the last year.
- The household survey increased by +222,000 jobs in August to 161.5 million employed. There have been declines in net employment in three of the last 11 months for a total increase of +3.1 million since March 2022 and +2.7 million since February 2020, which is well below the jobs added in the establishment survey for a number of reasons. The official U3 unemployment rate increased to 3.8% and the broader U6 underutilization rate increased to 7.1%. Since February 2020, the prime-age (25-54 years old) employment-population ratio is up by 0.4pp to 80.9%, the prime-age labor force participation rate was 0.5pp higher at 83.5%, and the total labor-force participation rate was 0.5-percentage-point lower at 62.8% with millions of people out of the labor force holding the U3 rate artificially low.
Economic Growth
The U.S. Bureau of Economic Analysis recently released the second estimate for economic output for Q2:2023.
- Table 1 provides data over time for real total gross domestic product (GDP), measured in chained 2012 dollars, and real private GDP, which excludes government consumption expenditures and gross investment.
Table 1: Economic Output, Growth, and Inflation
| Q4/Q4 2021 | Q4/Q4 2022 | Q1: 2022 | Q2: 2022 | Q3: 2022 | Q4: 2022 | Q1: 2023 | Q2: 2023 | |
|---|---|---|---|---|---|---|---|---|
| Real total GDP (end of period) | $20.0T | $20.2T | $19.9T | $19.9T | $20.1T | $20.2T | $20.3T | $20.4T |
| Annualized growth (avg for period) | +5.7% | +0.9% | -1.6% | -0.6% | +3.2% | +2.6% | +2.0% | +2.1% |
| Real private GDP (end of period) | $16.6T | $16.5T | $16.5T | $16.5T | $16.6T | $16.7T | $16.8T | $16.9T |
| Annualized growth (avg for period) | +6.9% | +0.9% | -1.5% | -0.4% | +3.1% | +2.3% | +1.4% | +1.8% |
| GDP implicit inflation (avg for period) | +6.1% | +6.4% | +8.4% | +9.1% | +4.4% | +3.9% | +4.1% | +2.0% |
The latest indicator of this concern is U.S. real GDP was revised lower to just a 2.1% increase last quarter. Another measure of economic activity is the real average of GDP and GDI which accounts for domestic production and income. It increased by just 1.3% to $20.2 trillion. This measure has declined in three of the last six quarters, increasing this value by only 0.8% since the first quarter of 2022.
Meanwhile, the federal budget deficit is growing faster because of overspending and declining tax collections from a slowing economy. The national debt has ballooned to nearly $33 trillion, and just net interest payments on the debt will soon be a top federal expenditure of at least $1 trillion. Adding to these fiscal challenges are other large expenditures, including $1.2 trillion in the so-called “Inflation Reduction Act.”
Figure 2: Fiscal Crisis Is Led by Spending Problem
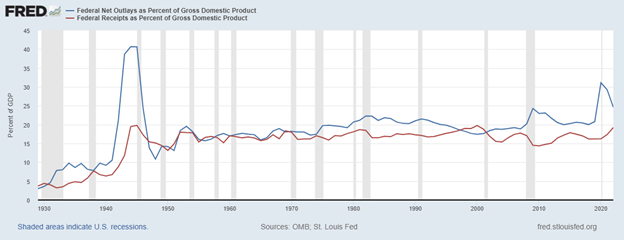
However, the Fed monetized much of the new debt to keep interest rates artificially lower. This created higher inflation as there was too much money chasing too few goods and services. And this has been exacerbated as production has been overregulated and overtaxed and workers have been given too many handouts. The Fed will need to cut its balance sheet (total assets over time) more aggressively if it is to stop manipulating markets (see this for types of assets on its balance sheet) and persistently tame inflation.
The current annual inflation rate of the consumer price index (CPI) has been cooling since a peak of +9.1% in June 2022 but remains elevated at above 3% in August 2023, which remains too high as are other key measures of inflation. Just as inflation is always and everywhere a monetary phenomenon, deficits and taxes are always and everywhere a spending problem. David Boaz at Cato Institute has noted how this problem is from both Republicans and Democrats.
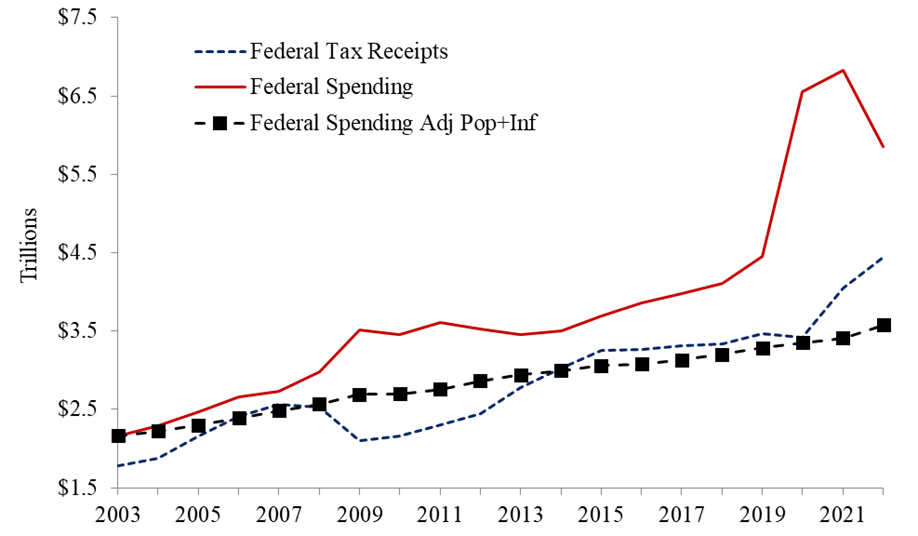
In order to get control of this fiscal crisis which is contributing to a monetary crisis, the U.S. needs a fiscal rule like the Responsible American Budget (RAB) with a maximum spending limit based on the rate of population growth plus inflation. If Congress had followed this approach from 2003 to 2022, the figure below shows tax receipts, spending, and spending adjusted for only population growth plus chained-CPI inflation. Instead of an (updated) $19.0 trillion national debt increase, there could have been only a $500 billion debt increase for a $18.5 trillion swing in a positive direction that would have substantially reduced the cost of this debt to Americans. The Republican Study Committee recently noted the strength of this type of fiscal rule in its FY 2023 “Blueprint to Save America.” And to top this off, the Federal Reserve should follow a monetary rule so that the costly discretion stops creating booms and busts.
Figure 3: Federal Budget Gap Shrinks If Spending Limited to Population Growth Plus Inflation
Bottom Line
Stagflation or a recession will continue given the “zombie economy” and the unraveling of the banking sector which will hit Main Street hard. Instead of passing massive spending bills, the path forward should include pro-growth policies that shrink government rather than big-government, progressive policies. It’s time for a limited government with sound fiscal and monetary policy that provides more opportunities for people to work and have more paths out of poverty.
Recommendations:
- Set a pro-growth policy path with less spending, regulating, and taxing at all levels of government, which includes return-to-work policies.
- Reject new spending packages that America cannot afford nor needs; pass the RAB instead.
Impose a strict monetary rule with the Fed having a much smaller balance sheet and a much higher federal funds rate target until we End the Fed.
Texans for Fiscal Responsibility relies on the support of private donors across the Lone Star State in order to promote fiscal responsibility and pro-taxpayer government in Texas. Please consider supporting our efforts! Thank you!
Get The Fiscal Note, our free weekly roll-up on all the current events that could impact your wallet. Subscribe today!